
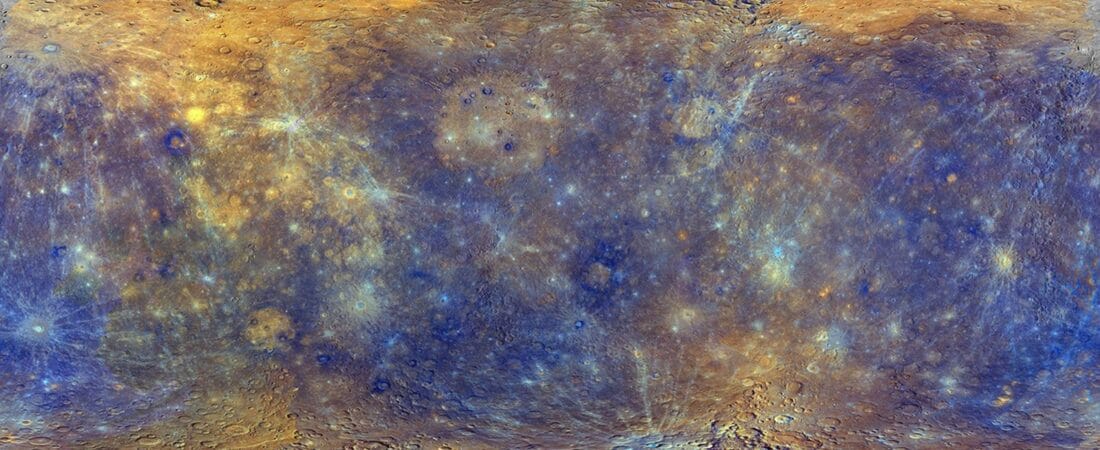
Mercury is shrinking because its interior is slowly losing heat. As the planet cools, its rock and metal contract. The rigid outer shell must fit around a slightly smaller world, so parts of the crust are pushed over neighboring terrain along thrust faults. Those faults create long cliffs and ridges called scarps.
The dramatic part of the story is real: Mercury has lost kilometers from its diameter over geological time, and a September 2026 study argues that earlier estimates missed some contraction because rough terrain can hide or suppress recognizable structures. The careful part matters too. Scientists did not watch Mercury suddenly shrink by 23 kilometers, and that figure is not a yearly rate. It is a model-based estimate of accumulated change across billions of years.
Why Mercury Is Shrinking
Mercury formed hot. Energy from impacts, radioactive decay, and the separation of dense material into a large metallic core all contributed heat early in the planet’s history. Over time, that heat escaped. Cooling material occupies less volume, so the interior contracted.
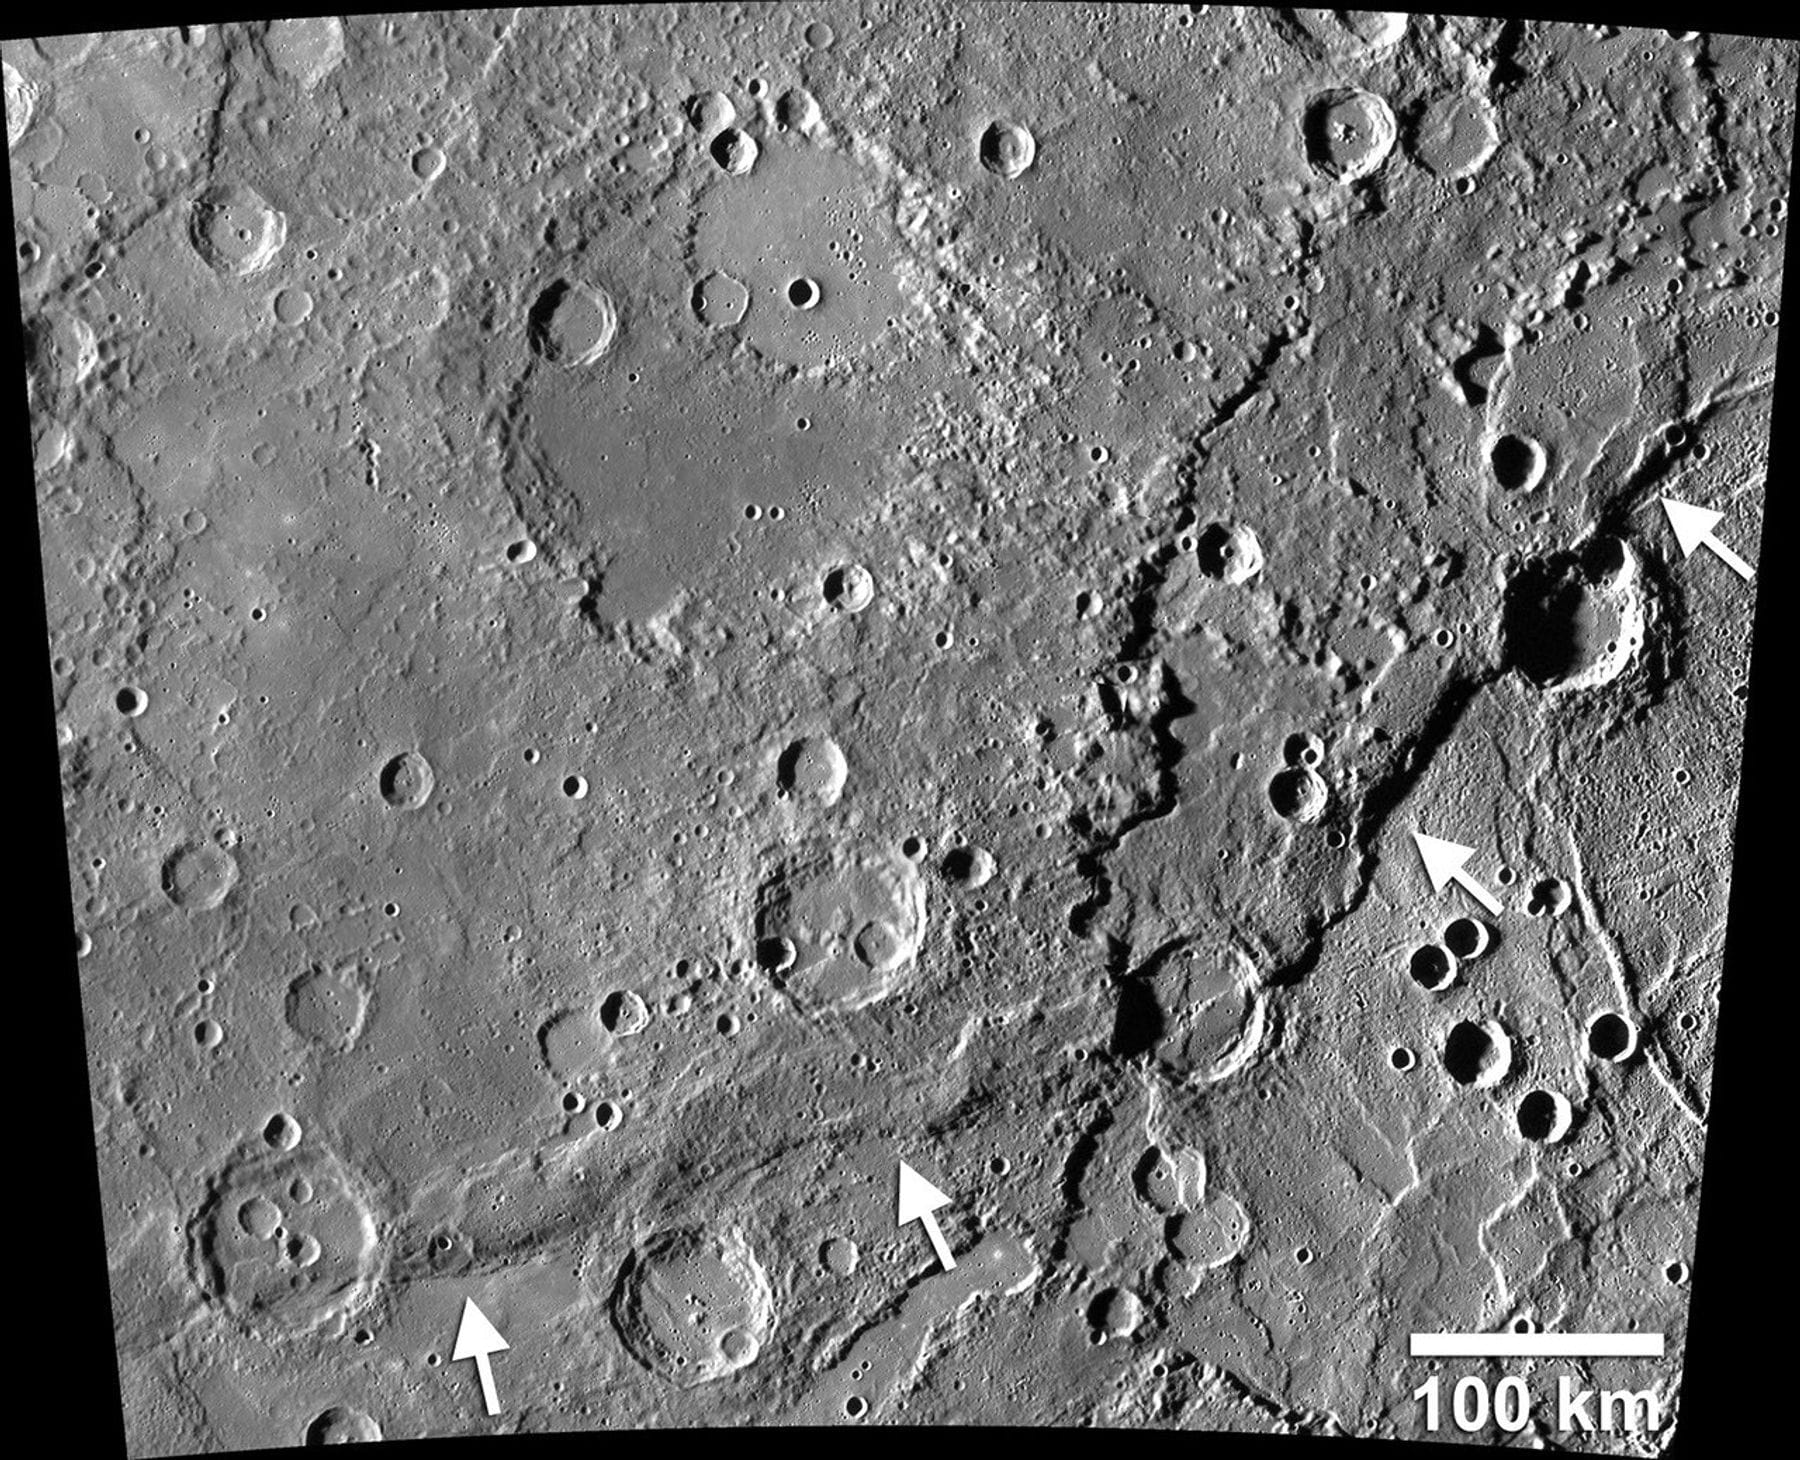
A planet cannot simply reduce its circumference without changing its surface. Imagine a firm shell wrapped around a sphere that becomes slightly smaller. The shell must break, fold, or overlap. On Mercury, the clearest expressions of that compression are lobate scarps: curved or irregular cliff-like landforms produced when one block of crust moves up and over another along a thrust fault.
These structures can extend for hundreds of kilometers, and some rise more than a kilometer above surrounding terrain. Their scale is one reason planetary geologists interpret them as evidence of global contraction rather than isolated local slumping. The pattern appears across the planet, not just around one crater or volcanic province. NASA’s overview of the MESSENGER findings connects the scarps directly to cooling and contraction inside Mercury.
How Scientists Read Mercury’s Wrinkled Surface
Scientists cannot place a tape measure around Mercury. Instead, they map landforms, estimate how much the crust shortened across faults, and use that shortening to reconstruct the change in planetary radius. The result depends on the number of structures recognized, their geometry, their displacement, and the assumptions used to translate local faulting into global contraction.
Mariner 10 revealed part of Mercury in the 1970s, but it did not image the entire planet. NASA’s MESSENGER spacecraft changed the picture. It entered orbit in 2011 and mapped Mercury globally before its planned impact in 2015. MESSENGER’s cameras and laser altimeter gave researchers the coverage and topographic information needed to examine scarps in far more detail.
Late in the mission, MESSENGER flew at lower altitudes and returned sharper images. Those observations revealed small fault scarps that had previously escaped detection. Their crisp shapes and relationships with small impact craters suggested that at least some movement occurred relatively recently in geological terms. “Recent” here can still mean millions of years, not something witnessed during the spacecraft’s lifetime.
What the 2026 Mercury Contraction Study Changed
In September 2026, Gaku Nishiyama and colleagues published a study in Geophysical Research Letters that examined a basic mapping problem: faults are easier to recognize in some landscapes than in others. Rough surfaces, impact debris, and later modification can obscure scarps that once recorded contraction. Rough terrain may also influence where recognizable structures form.
The researchers compared a global surface-roughness map with the distribution of mapped contractional structures. They found fewer recognizable structures in rougher regions. That relationship indicates that a simple count of visible scarps can underestimate the total amount of crustal shortening.
One correction in the paper yields about 11.6 kilometers of radius reduction—roughly 23 kilometers across the diameter. The American Geophysical Union summarized the result as evidence that Mercury may have shrunk 10 to 30 percent more than earlier estimates suggested. The exact correction depends on how researchers treat small structures and whether those features record global cooling, local tectonics, or a mixture of both.
This distinction keeps the headline honest. The study improves an estimate of Mercury’s total historical contraction. It does not measure a current annual rate, show a 23-kilometer change between two spacecraft photographs, or predict that the planet will rapidly collapse. Read the primary 2026 paper and AGU’s research summary.
Is Mercury Still Geologically Active?
The strongest evidence for long-lived activity comes from small, relatively fresh structures. A 2016 study led by Thomas Watters used MESSENGER’s low-altitude images to identify small thrust-fault scarps. Because constant impacts gradually degrade exposed landforms, a sharply preserved small scarp is unlikely to have survived unchanged since Mercury’s earliest history.
The researchers estimated that some of those scarps are younger than about 50 million years. In a Solar System about 4.6 billion years old, that is geologically recent. The finding supports the idea that Mercury’s interior remained warm enough for contractional tectonics to continue much later than once assumed. Read Watters and colleagues’ 2016 study.
A 2023 study added a different line of evidence. Researchers mapped narrow troughs called grabens on top of larger contractional structures. Their interpretation was that the larger scarps experienced movement that stretched the upper surface locally, producing the troughs. Based on their preservation and the expected filling of depressions by impact material, the team estimated ages of roughly 300 million years or younger. Read the 2023 Nature Geoscience paper.
Neither study recorded a Mercury-quake directly. No seismometer has operated on the surface. The evidence is geological: landforms, cross-cutting relationships, crater modification, and models of how quickly small features should degrade. Scientists can reasonably infer late activity while still acknowledging that the timing of the most recent individual event is unknown.
Why “Still Shrinking” Needs Context
“Mercury is still shrinking” is a strong, useful hook because the planet’s contraction is a continuing thermal process, and young-looking fault scarps imply that tectonic movement persisted into the recent geological past. The phrase becomes misleading only when it is treated like a live measurement of rapid size loss.
- Observed: thousands of contraction-related cliffs and ridges across Mercury, including small sharp scarps.
- Measured from maps: the dimensions, distribution, and topography of those landforms.
- Inferred: the amount of crustal shortening and corresponding reduction in planetary radius.
- Still uncertain: the exact global total, the age of every structure, and the present frequency or strength of Mercury-quakes.
This evidence ladder also explains why estimates can change. A new map or model does not mean the planet suddenly changed. It means researchers found a better way to interpret a surface record that was already there.
What Mercury’s Contraction Reveals About Its Interior
Mercury is unusually dense for its size and has an enormous metallic core relative to its thin rocky mantle. Contraction provides a clue to how that interior cooled. A larger estimate of radius loss places stronger constraints on thermal-history models: a model must allow enough cooling to produce the mapped shortening while remaining consistent with Mercury’s magnetic field, volcanic history, and crustal structure.
MESSENGER also showed that Mercury contains more volatile elements than many older formation scenarios predicted. That result complicated the simple idea that the planet was stripped or baked down to a dry metal-rich remnant. The shrinking story therefore sits inside a larger puzzle: how did Mercury form, why is its core so large, and how has heat moved through the planet since then?
Contraction alone cannot answer all of those questions. It is one observable consequence of a hidden thermal history. Combining tectonic maps with composition, gravity, magnetic-field measurements, and topography gives researchers a more complete test of interior models.
How Mercury Compares With the Moon
Mercury is not the only small rocky world with contractional scarps. Earth’s Moon also has young thrust-fault scarps associated with gradual cooling and shrinking. NASA notes that Mercury’s small scarps resemble young lunar examples. That comparison helps scientists recognize familiar mechanical behavior across different worlds.
The comparison does not mean the two bodies have identical interiors or tectonic histories. Mercury has a proportionally larger core, a global magnetic field, different temperatures, and a different impact and volcanic record. Similar landforms can arise from the same broad physical process while preserving distinct histories.
What BepiColombo Could Clarify
BepiColombo, the joint ESA-JAXA mission, is designed to study Mercury with two orbiters. ESA’s current arrival plan places Mercury orbit insertion on November 21, 2026, followed by additional maneuvers. The Mercury Planetary Orbiter is expected to reach its science orbit in March 2027. Arrival and routine science operations are separate milestones.
The mission can improve imaging, topography, composition, magnetic-field, and environment measurements. Better coverage and different viewing conditions may reveal structures that MESSENGER could not resolve or characterize fully. Researchers will be able to compare new observations with existing maps and refine models of the planet’s interior and surface evolution.
BepiColombo is not guaranteed to deliver a single definitive “shrinkage rate.” The tectonic record spans vast time, and the mission does not include a surface seismometer. Its value is broader: more precise observations can reduce uncertainty in several connected pieces of the thermal-history puzzle. Review ESA’s current mission timeline.
Why Surface Roughness Can Hide a Planetary Record
A fault scarp is easiest to map when it creates a clean, continuous break across a comparatively smooth plain. Rough terrain makes that job harder. Crater rims, overlapping ejecta, irregular slopes, and later impacts can interrupt the shape a mapper is trying to follow. A structure can be real without presenting the textbook outline that makes it easy to add to a global catalog.
This is an example of detection bias in planetary geology. The number of features in a database reflects both nature and the limits of observation. Camera resolution, lighting angle, topography, surface preservation, and the definitions used by different mapping teams all affect what becomes visible. A smoother region may appear to contain more faults partly because its faults are easier to identify.
Nishiyama and colleagues did not simply assume that every rough patch hides the same number of scarps. They tested the relationship between mapped structures and a global measure of roughness, then evaluated how correcting for that relationship changes contraction estimates. Their result is a modeled correction with explicit assumptions, which is why the paper discusses a range and alternative interpretations rather than claiming a perfect census.
How a Fault Map Becomes a Shrinkage Estimate
Planetary contraction is commonly reported as a reduction in radius or diameter, but the starting observations are local. Researchers estimate horizontal shortening across individual thrust faults, combine measurements across mapped structures, account for the portion of the surface sampled, and relate the total shortening to the circumference of the planet. Each step introduces uncertainty.
Fault geometry matters because the visible height of a cliff is not identical to the amount of horizontal crustal shortening. The dip of the fault beneath the surface and the displacement along it must be considered. Structures that are buried, eroded, poorly illuminated, or below image resolution contribute no direct measurement even if they exist. This is exactly where a roughness correction can change the answer.
The conversion from an estimated 11.6-kilometer radius loss to about 23 kilometers of diameter loss is simple geometry: diameter is twice radius. The scientific challenge lies upstream in deciding how much total shortening the visible and inferred faults represent. That is why two apparently precise numbers should still be read as parts of a model, not as measurements to the nearest meter.
What Mercury’s Shrinking Does Not Affect
Mercury’s geological contraction does not change the meaning of Mercury retrograde, personal astrology, communications, relationships, or events on Earth. Those are separate interpretive traditions. The physical claim discussed here comes from planetary images, topography, fault mapping, and thermal models.
The contraction is also too small and slow to alter Mercury’s orbit in the sensational way sometimes implied by social posts. It does not pull the planet toward the Sun, make it unstable, or create a threat to Earth. Its significance is scientific: the surface preserves evidence about a core and mantle that cannot be sampled directly.
Watch the DCI Short
Watch the Mercury Short on YouTube. The video is the quick doorway; the evidence and qualifications above explain how the estimate works.
Mercury Is Shrinking FAQ
Why is Mercury shrinking?
Mercury is shrinking because its interior is gradually losing heat. Cooling rock and metal contract, reducing the planet’s volume. The rigid crust responds by breaking and overlapping along thrust faults, producing cliffs called scarps. Scientists map those structures and estimate their displacement to reconstruct how much the planet’s radius changed over geological time.
How much has Mercury shrunk?
A 2026 study calculated one roughness-corrected estimate of about 11.6 kilometers of radius loss, equivalent to roughly 23 kilometers across Mercury’s diameter. That is accumulated contraction over much of the planet’s history, not a sudden change. The value remains model-dependent because some faults may be hidden and some small structures may reflect local processes.
Is Mercury shrinking right now?
Mercury should continue cooling, but scientists have not directly measured a present-day annual shrinkage rate. Small, sharply preserved scarps and younger troughs indicate that tectonic activity continued into the geologically recent past. That evidence supports a long-lived process, while the timing of the latest individual fault movement remains unknown.
Will Mercury eventually disappear?
No. Planetary contraction is tiny compared with Mercury’s full diameter of about 4,880 kilometers, and cooling slows over time. A historical diameter loss measured in tens of kilometers is scientifically important because it reveals the interior’s evolution, but it does not imply that the planet is collapsing or will vanish.
What are Mercury’s scarps?
Scarps are cliff-like landforms created by faults. On Mercury, many are lobate scarps formed when compression pushed one section of crust over another. Large scarps can run for hundreds of kilometers. Smaller scarps discovered in high-resolution MESSENGER images are valuable because their sharp preservation provides evidence for comparatively recent movement.
Does Mercury have earthquakes?
Mercury may experience tectonic quakes, sometimes informally called Mercury-quakes, but none has been measured directly because no seismometer has operated on the surface. Researchers infer fault movement from landforms. The young-looking scarps make ongoing or recent seismic activity plausible, yet the frequency and strength of such events are still unknown.
Did MESSENGER watch Mercury shrink?
No. MESSENGER mapped the geological evidence left by contraction. Scientists measured faults, topography, and surface relationships in its images, then used those observations to estimate past radius loss. The spacecraft’s four years in orbit were far too short to photograph a planet-wide diameter change of the kind accumulated over billions of years.
What will BepiColombo add to the Mercury shrinking story?
BepiColombo can provide new imaging, topography, composition, magnetic-field, and environmental measurements from two orbiters. Those observations may expose previously unmapped structures and improve models of Mercury’s crust and interior. The mission can narrow uncertainties, although it is not guaranteed to produce one direct modern shrinkage rate.
Keep Exploring
Return to Science & Discovery or explore what surviving pigments reveal about ancient Egypt.
For a space-themed puzzle break, COA’s Space Code Activity Pack offers printable mazes, word search, and sudoku. It is an optional activity product, not a source for the scientific claims in this article.
Editorial note: This article makes no connection between Mercury’s tectonics and astrological interpretations. Draft prepared September 21, 2026; publication and modification dates will be assigned by WordPress on release.